Introduction
Ever wondered why your program runs so slowly in some points? How does one even start to know where the bottle necks are?
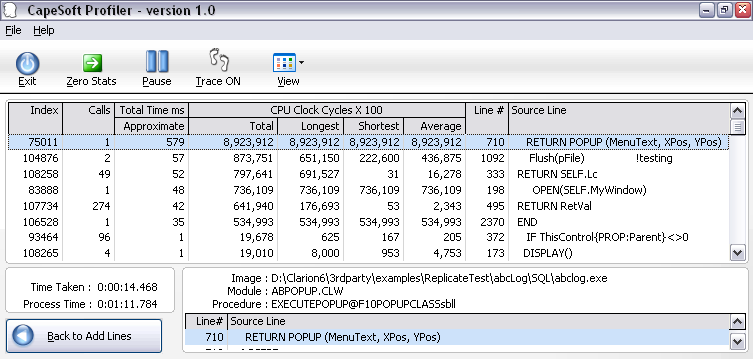
Enter CapeSoft Profiler. CapeSoft Profiler points you to the exact lines of code in your program (even in Multi-DLL applications)
that are the bottlenecks in your application. It shows you the lines surrounding the code as well as the module, making it easy for
you to make the necessary changes to the source in your Clarion IDE.
Note: Now runs on 64 bit operating systems.
ClarionLive
You can watch a training Webinar on debugging and profiling, using Profiler, at www.clarionlive.com,
webinar number 16. You can download the webinar
here.
Features
- Is simple to "add" to your program (just turn on full debugging and compile)
- Gathers useful statistics such as the number of times that a source line is executed and the CPU time taken to execute.
- Reveals "slow" sections in your application that appear even in "well written code".
- Is a shell application that controls your application and displays comparative source code line duration times in a sortable list box.
- Sortable columns allow you to get quickly to the "slow" code.
- Using SendTo, you can output results to your Printer, HTML, Word, Excel, etc.
What's new in Profiler 3
- Windows 64 bit support: profiler your application in a 64 bit
operating system. NOTE: Your application is still a 32 bit application.
- Clarion 8 support: improved support for running in a Clarion 8
environment.
- Clean interface: improvements to stored settings, easier to manage
selection (wizard shortened), resizing improvements, etc.
- How do I upgrade: You need to purchase an upgrade
from Clarionshop:
https://www.clarionshop.com/checkout.cfm?pid=1409&q=1&
Not ready to upgrade? You can download the old Profiler version
2 (without purchasing an upgrade) from:
www.capesoft.com/ftp/public/profiler2install.saf
Compatible With
| Clarion 6 | No |
| Clarion 7 | No |
| Clarion 8 | Yes |
| Clarion 9 | Yes |
| Clarion 10 | Yes |
| Clarion Templates | Yes |
| ABC Templates | Yes |
| Local Mode | Yes |
| DLL Mode | Yes |
| Multi DLL | Yes |
What the users are saying
Jim Kane (article on the softvelocity.clarion.third_party
news group), 13 April 2006:
....I ran the profiler first and it showed me that a call to a com method
was taking virtually 99% of the time for a procedure to run. Optimizing
queue vs array would have been pointless. Sometimes knowing what not to do
is as important as what to do.
Highly recommended. Beats the heck out of flying blind.
Gregory Bailey (article on the
softvelocity.clarion.third_party news group), 13 April 2006:
I found that using it made a huge difference in the wall clock timing of a
large piece of code that I inherited from another long gone
developer....Rewriting those bits of code allowed the process to complete in
1 - 3 hours a night. The customer is estatic (sic) with the
results. Sure this could have been done without Profiler, but I still would
be looking for code to optimize and might not have connected the 5 places in
different portions of the code that read that same file.
Andre Doman (an email February 03, 2012): I just started using profiler. What a stunning product. It took me 10
minutes and I know where my problem is.
Russ Eggen:
"consider Profiler a mandatory tool in your debugging tool kit."
Bill Wilson:
"But with Profiler and the techniques Bruce demonstrated, I had loaded this
project, found over 3.5 seconds of the (4 second) problem, fixed it and
recompiled within 10 minutes...So a big thanks to Bruce and the Team at
Capesoft for an exceptional tool. 10/10!"
Cost
| The price of Profiler is $377. It is
available for purchase from
ClarionShop. |
| The upgrade (from earlier
versions of Profiler) is available for purchase for $197 from
ClarionShop. |
For other payment options please contact us
here
Refund Policy
CapeSoft believes that if you aren't satisfied with our products, we would like them back - and we
will refund you the money. This allows you to purchase our products with confidence.
You can read our full refund policy
here.