GPFReporter header linked to CapeSoft home page  
Version version number Gold
CapeSoft Software copyright
www.capesoft.com
     

horizontal rule

Products Required for GPFReporter
  bullet small HyperActive  
bullet small WinEvent
     

horizontal rule

Contents
 
bullet small Introduction
bullet small Features
bullet small Adding GPFReporter to your Application
bullet small Options for the GPFReporter template
bullet small Interpretting the GPFReport
bullet small Properties for the GPFRep class ; Methods for the GPFRep class
bullet small Distribution
bullet small Examples
bullet small Tips & FAQ 
bullet small Support
bullet small Installation
bullet small License &Copyright
bullet small Version History


horizontal rule

bulletIntroduction
 

The CapeSoft GPFReporter allows you to trap program "illegal operations" and offers the user the opportunity to email a short report to the developer detailing the illegal operation.

Note : Now supports Win95, Win98, WinNT, Win2k and WinXP
 
horizontal rule

bulletFeatures


horizontal rule

bulletAdding GPFReporter to your Application

Adding GPFReporter to your Application is easy.

1. While the App is Open go to the Global Extensions. Click on Insert.
2.
Select Activate CapeSoft's GPF Reporter from the Class CapeSoftGPF.
3. Fill in the email address(es) to which you would like GPF reports sent.
4. Fill in your program title.  This will appear on the GPF messagebox title bar.
5. Give your program a version number.  This is so that you can identify which version of your program has the problem.
6.
Select Activate CapeSoft's HyperActive from the Class HyperActive. (Only if not already Active)
7. Select Enable the WinEvent functions in your app from the Class WinEvent. (Only if not already Active)
8. Close and save the window.
9. You need to set your project into full debugmode with line numbers - to do this, open the project, click the properties button and set the debug options accordingly. (In Clarion 7.1, you need to set the Build mode to Debug. In the Build menu, select Set Configuration to Debug

NOTE : For multi-DLL applications only add GPFReporter to the main (EXE).  See FAQ for more info.

horizontal rule

bullet Interpreting the GPF Report

When GPFReporter captures a GPF, it will display a report a bit similar to the following:

GPFReport Message screenshot

The Error at address shows the stack address at which the GPF occurred (i.e. line number 0). 

[01] was the line of code that called the method that the actual GPF occurred in. 
[02] was the line of code that called the the code in [01]
and so on......

Normally the code that actually caused the GPF to occur would not appear right on the top line, (i.e. at the Error at address line), but in this case this was it. Often you'll need to go down the list (of stack entries that GPFReporter interprets for you) to find the last point in your code which was called. You'll probably have to wade through some ABC method code, and some code called from within the runtime libraries. Even the last line of your code that you can find in the stack trace may not necessarily be the line causing the GPF - there could be some variables set prior to that with null values or the like. A lot of times GPFReporter will pinpoint the exact line of code causing the GPF, but often it'll point you in the general direction and you'll need to do some sleuthing yourself.

Note: if you have no line numbers in the stack trace, then you need to turn this on in the debug settings of your project:

GPFReporter Project Settings screenshot

horizontal rule

bulletOptions for the GPFReporter Template

bullet smallGeneral Tab

bullet smallSettings Tab

bullet smallAdvanced Tab

bullet smallClass Tab

horizontal rule

bullet Distribution

For Win95, Win98 and WinNT the redistributable DBGHELP.DLL is used to create the stack trace. 
Please place this DLL in the application directory (not the windows directory).
You will find a copy in your \clarion X\3rdParty\bin directory.

horizontal rule

bullet Examples

There is an example in your \ClarionX\3rdParty\Examples\GPFRep directory.

horizontal rule

bulletTips & FAQ

Clarion Versions : GPFReporter is available for Clarion 5, 5.5, 6 and 7.  There is no upgrade charge. Download from www.capesoft.com .

Interpreting the GPF Report
bullet small The GPF Report says that the error occurred on a line past the end of my source.  Why.
bullet small How do I interpret the Stack Trace?
bullet small The GPF Reporter says that the exception occurred at address : XXXXXXXXh no module. What does this mean?
bullet small The GPF Report Stack Trace is empty. Why?
bullet small The GPF Reporter reports that the exception occurred in the "Library state". What does this mean?
bullet small My stack trace shows lines prefixed with ???. What does this signify.
bullet small
My GPF report contains the expression "Line ?=XXXX"  Is the GPF Reporter unsure?

Emailing Issues
bullet small I am using Eudora and GPF Reports containing & or ? do not eMail correctly.  What can I do?
bullet small When we try to run your demo, instead of Outlook client opening up, we have 32 web pages pop up with the following URL:
mailto:Jim%20<jim_zetterberg@simonton.com>...etc


Runtime GPF Issues
bullet small My application gives me an "index out of range" error. How do I locate the error line?
bullet small Which exceptions are handled by the GPF Reporter?

Other Runtime issues
bullet small I know there was a GPF but the GPF reporter never executed.
bullet small My program exits without GPF reporter displaying any messages.
bullet small I get the " Assertion failed on line: 303 in file abfile.clw. Message: You are calling CLOSE(thefile) instead of FileManager.close().
bullet small I'm using Clarion 7, but no line numbers are shown in the GPF report


Programming Issues

bullet small My application is a large multi DLL application, do I have to enable debugging and recompile all the DLL's. 
bullet small How do I add GPFReporter to a multi-DLL application.
bullet small Will using "min" or "full" debug settings slow my program load / execution time?
bullet small I am using Armadillo and now the GPF Reporter no longer works. Is there a work around?
bullet smallI don't want any messages to appear, and I want my app/service to restart and email me the logfile.

FAQ 1 My application gives me an "index out of range" error.  How do I 
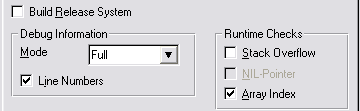
locate the error line?

Answer: If you enable array index range checking (project property) then the range checker will ask "Do you want to GPF?"  If you select "Yes" then the GPFReporter will report that your application GPF'd in the clarion runtime (range checker).  The actual line where the error occurred is lost however the stack trace shows where that procedure was called from.  This usually narrows your search down to one procedure.

FAQ 2 My application is a large multi DLL application, do I have to enable debugging and recompile all the DLL's.

Answer: No, the GPFReporter will identify the module in which the GPF occurred and only that module need be recompiled with the "Debug Information" mode set to FULL or MIN (not OFF).  This will provide the source module line number where the GPF occurred.

FAQ 3 How do I add GPFReporter to a multi-DLL application.

Answer: The GPFReporter should only be added to the EXE.  The GPFReporter is installed as the default exception handler and will work for all threads including DLL calls.

FAQ 4 The GPF Report says that the error occurred on a line past the end of my source.  Why.

Answer: The GPF Reporter line numbers are for the CLW modules, not the embedded source.  In the clarion IDE right-click and select MODULE not SOURCE.
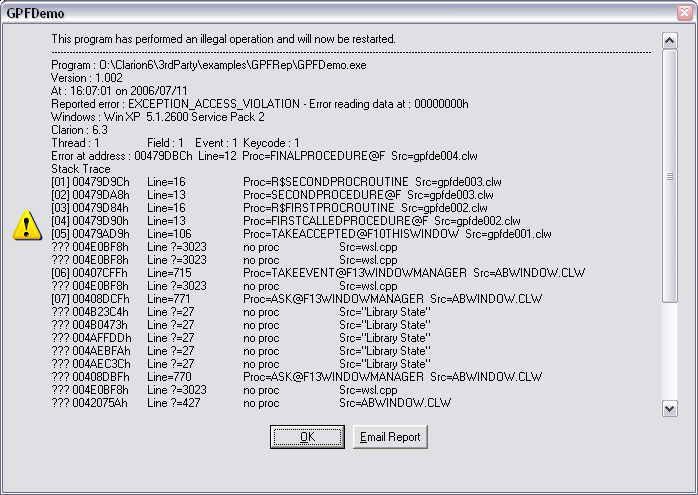
FAQ 5 How do I interpret the Stack Trace?

Answer: The Stack trace is "upside down".  The most recently used procedures are at the top.  The "main" should be at the bottom unless this exception occurred on closing the application.

FAQ 6 The GPF Reporter says that the exception occurred at address : XXXXXXXXh no module.  What does this mean?

Answer: This means that the program is executing outside of the code space of any of its modules.  This can happen when your program calls an invalid procedure pointer. 

FAQ 7 The GPF Report Stack Trace is empty.  Why?

Answer: Possibly your program has caused an exception while loading or exiting the clarion runtime code.  This is unlikely.  Usually what has happened is that the program has trashed the return stack and so the Stack Trace is garbage.

A very common programming error that results in a trashed stack is to use string slicing with reversed position numbers. 
Example :     IF SomeString[6 : 3] = 'ABC' ....
Unfortunately the debug "array range checking" tests that the positions fall in the string but fails to test for illegal position numbers.

FAQ 8 Which exceptions are handled by the GPF Reporter?

Answer: Any exception that would usually end your application with the windows exception handler.  The following are defined:

EXCEPTION_ACCESS_VIOLATION (0C0000005h)
EXCEPTION_DATATYPE_MISALIGNMENT (080000002h)
EXCEPTION_BREAKPOINT (080000003h)
EXCEPTION_SINGLE_STEP (080000004h)
EXCEPTION_ARRAY_BOUNDS_EXCEEDED (0C000008Ch)
EXCEPTION_FLT_DENORMAL_OPERAND (0C000008Dh)
EXCEPTION_FLT_DIVIDE_BY_ZERO (0C000008Eh)
EXCEPTION_FLT_INEXACT_RESULT (0C000008Fh)
EXCEPTION_FLT_INVALID_OPERATION (0C0000090h)
EXCEPTION_FLT_OVERFLOW (0C0000091h)
EXCEPTION_FLT_STACK_CHECK (0C0000092h)
EXCEPTION_FLT_UNDERFLOW (0C0000093h)
EXCEPTION_INT_DIVIDE_BY_ZERO (0C0000094h)
EXCEPTION_INT_OVERFLOW (0C0000095h)
EXCEPTION_PRIV_INSTRUCTION (0C0000096h)
EXCEPTION_IN_PAGE_ERROR (0C0000006h)
EXCEPTION_ILLEGAL_INSTRUCTION (0C000001Dh)
EXCEPTION_NONCONTINUABLE_EXCEPTION (0C0000025h)
EXCEPTION_STACK_OVERFLOW (0C00000FDh)
EXCEPTION_INVALID_DISPOSITION (0C0000026h)
EXCEPTION_GUARD_PAGE (080000001h)
EXCEPTION_INVALID_HANDLE (0C0000008h)
 

FAQ 9 The GPF Reporter reports that the exception occurred in the "Library state".  What does this mean?

Answer: "Library state" is the label given by the clarion compiler to code inside the clarion RTL (C60RUNX.DLL) or LIB.  This is where most exceptions occur (as your program code is a series of calls to clarion functions).  Before you send a bug report to SV please read on.

You need to locate where in YOUR code you called this clarion library code from.  Once you have established where your code called the library then you must find the reason for the exception (usually something done, not done or done too soon).

The stack trace is there to show you where in YOUR code the clarion library was called from.  See FAQ 5 & 7.

FAQ 10 My stack trace shows lines prefixed with ???.  What does this signify.

Answer: These are addresses on the stack which might be part of the calling chain. 

If a procedure makes a call to another procedure then it may (optionally) push the EBP ("Stack Frame Pointer") onto the stack and then copy the ESP ("Stack Pointer") over the EBP.  This allows us to "walk" back down the stack using the pushed EBP / EIP ("return address") pairs.

If the called procedure does not push the EBP and then calls a 3rd procedure which does push the EBP then it appears, from the stack trace, that the first procedure called the 3rd procedure.  The second is "lost".    

FAQ 11 My GPF report contains the expression "Line ?=XXXX"  Is the GPF Reporter unsure?

Answer: Yes. This occurs where "min" debug info is compiled into the program / DLL.

If possible compile the module with "full" debug info.  The GPF Reporter can then verify the ?= line numbers. 

FAQ 12 Will using "min" or "full" debug settings slow my program load / execution time?

Answer: Yes the program will take longer to load and will execute more code.  However the change is usually not noticeable.

Please note that although the EXE / DLL might increase in size by a large amount (often from 1mByte to 10mBytes) this does not affect the load / execution speed.  The debug info added to the EXE / DLL file is not loaded into program memory.

The program is however not optimized by the compiler in debug mode and index range checking etc adds extra code which accounts for the slower load / execution times.

FAQ 13 I am using Armadillo and now the GPF Reporter no longer works.  Is there a work around?

Answer: Yes.  In the Armadillo options you will need to set the "Data after program" option to "Fake original data location".
This is only available in the Armadillo Professional edition.
The GPF Reporter then works correctly.

FAQ 14 I am using Eudora and GPF Reports containing & or ? do not eMail correctly.  What can I do?

Answer: Select the "Always use Paste Method" Email option.

FAQ 15 I know there was a GPF but the GPF reporter never executed.

Answer: Uncheck the "Enable Wait Window" option. 
Often after a GPF the clarion runtime library (in memory) is not able to open the wait window.  The GPF Reporter then GPF's while opening this window and as it is installed as the GPF handler....

If the above does not resolve the problem then try setting the "close quietly" option.  Look in the GPF Report Log for the report.

FAQ 16
I've added GPF Reporter to my program. This requires that debugging be switched on. Now I get the " Assertion failed on line: 303 in file abfile.clw. Message: You are calling CLOSE(thefile) instead of FileManager.close(). Shall I GPF?" error! How can GPF Reporter and FM3 co-exist?
 
Answer: GPF Reporter Clarion's Debug mode to be switched on. As most of you know, ABC has an over sensitive assert warning when you've used a legacy close() instead on an Access:File.close() (see GQxx for more info). The only way to allow FM2/3 and GPF Reporter to co-exist in an application is to comment our the assert in your abfile.clw in your Clarion\libsrc directory.
FAQ 17 When we try to run your demo, instead of Outlook client opening up, we have 32 web pages pop up with the following URL:
mailto:Jim%20<jim_zetterberg@simonton.com>...etc

Answer: Have you just changed mail servers GroupWise to Exchange - and maybe the client install didn't go as smoothly as it should have?

Solution: In the IE browser, go to Tools, Internet Options, Programs Tab
a. Changed E-mail from Microsoft Office Outlook to Outlook Express.
b. Changed it back to Microsoft Office Outlook.  Problem was solved.

FAQ 18 My program exits without GPF reporter displaying any messages.

It could be that the program exited under (albeit unknown) instruction. Occasionally the program GPF's so badly, that it cannot even display the message window to show the GPF. In this case, you will only be able to view the GPF logfile in order to see what the problem was. The logfile is made in the directory specified in the GPF Reporter Global Extension template

FAQ 19 I don't want any messages to appear, and I want my app/service to restart and email me the logfile.

In the Settings tab of your GPF Reporter global extension template, you need to do the following:

  1. Check the "Restart  Program" checkbox.
  2. In the "MessageBox Options", select the "Email Only" radio button.
  3. In the "Email Options" group, you need to select the "Split eMails if report too long" radio button.

You will get multiple emails for the same GPF (broken into 2 or 3 parts) - but you will get the report pasted into the email. The user will just need to hit send on each email.

FAQ 20 I'm using Clarion 7, but no line numbers are shown in the GPF report.

You need to set the Build mode to Debug. In the Build menu, select Set Configuration to Debug

horizontal rule

bulletGPFRep Class Properties

CloseQuietly (byte) : When set then the exception handler terminates the process without any message.  This is useful for services which can be restarted without first closing the exception message window.  The Report is still sent to the GPF dumpfile.

Disable (byte) : When set this disables the GPF Reporter exception handler.  Exceptions will go the the default windows exception handler.

RestartProgram (byte): Set this to immediately restart the program after the GPF occurs.

ShowDetails (byte): This should be 0. To view additional stack details, set this to 1 (but it makes your logfile close to unreadable).

DumpFileName (string) : A copy of the exception report text is placed in this file.  The GPF Report text overwrites this file (unless DumpFileAppend is set).

ReportText : This string is appended to the bottom of the GPF Report.  This is intended for use with the ExtraReportText method (below).
Embedded CR/LF ('<13,10>') will format the text on multiple lines.

TextForMessage1 : Default= 'This program has performed an illegal operation and will now end.'
TextForMessage2 : Default= 'This program has performed an illegal operation and will now end.'
TextForOKButton : Default= 'OK'
TextForDetailsButton : Default= '&Details'
TextForEmailButton : Default= '&Email Report'
TextForPasteInstructions : Default= 'Edit|Paste the report here (CTL+V) or attach the logfile.'
TextForProgram : Default= 'Program'
TextForVersion : Default= 'Version'
TextForTime : Default= 'At'
TextForDate : Default= 'on'
DateFormat : Default= '@d10'
TextForReportedError : Default= 'Reported error'
TextForAccessViolation : Default= 'EXCEPTION_ACCESS_VIOLATION'
TextForErrorReadingData : Default= 'Error reading data at'
TextForErrorWritingData : Default= 'Error writing data at'
TextForOS : Default= 'Windows'
TextForClarion : Default= 'Clarion'
TextForThread : Default= 'Thread'
TextForErrorAtAddress : Default= 'Error at address'
TextForStackTrace : Default= 'Stack Trace'
TextForStackDump : Default= 'Stack Dump'
TextForDLLMissing : Default= 'Please copy DBGHELP.DLL into the application directory.<13,10>This will enable GPF Reporter to provide more information (Win98/NT only).'
TextForStackCorrupt : Default= '*** Error Stack corrupt ***'
TextForStackTraceStopped : Default= 'Stack Trace stopped, too many levels'
TextForEnd : Default= 'END'
TextForPart : Default= 'PART'
TextForLine : Default= 'Line'
TextForProc : Default= 'Proc'
TextForSrc : Default= 'Src'
TextForModule : Default= 'Module'
TextForDebugInfoNotFound : Default= 'no debug info'
TextForModuleNotFound : Default= 'no module'
TextForLineNotFound : Default= 'no line number'
TextForPleaseWait : Default= 'Please wait, reading debug information'
TextForPleaseWait2 : Default= 'Please wait, loading email program'
TextForField : Default= 'Field'
TextForEvent : Default= 'Event'
TextForKeycode : Default= 'Keycode'
TextForTopWindow : Default= 'Top Window'
TextForTruncated : Default= '***Truncated***'
TextForNoProc : Default= 'no proc'

horizontal rule

bulletGPFRep Class Methods

DeleteDumpFile : This method deletes the current GPF report log file.  This may be useful if appending to dumpfile is selected.

ExtraReportText : This method is called after the program has performed an exception.
You may provide extra debugging info in the GPF Report by setting the ReportText property here.  Example:

  self.ReportText = 'User=' & clip(CurrentUser) & '<13,10>This text is on a new line.'

Please note that there are some limitations on code that may be executed from inside an exception handler (here).
1) You may not use NEW (allocate memory).
2) You may not execute code that will generate an exception (such as calling OutputDebugString without a debugger present). 

horizontal rule

bulletSupport

Your questions, comments and suggestions are welcome. Check our web page ( www.capesoft.com/accessories/downloads.htm ) for new versions. You can also contact us in one of the following ways.

CapeSoft Support
  Support Page Find support page with various options here  
Email  
Telephone +27 21 715 4000
Fax +27 21 715 2535
Post PO Box 511, Plumstead, 7801, Cape Town, South Africa


GPFReporter is available for purchase at $149 from:

CapeSoft Sales
  Web www.capesoft.com  
Email sales at capesoft dot com 
Telephone +27 21 715 4000
Fax +27 21 715 2535
Post PO Box 511, Plumstead, 7801, Cape Town, South Africa


Buy Online
  Web  


horizontal rule

bulletInstallation

1. Run the supplied installation file.

horizontal rule

bulletLicense & Copyright

This product is copyright © 2004-2010 by CapeSoft Software.

You are not allowed to copy any of the files, including but not limited to, csGPF.tpl, csGPF.tpw, csGPF.clw, csGPF.inc and documentation files.

None of the included files may be distributed. Your programs which use GPFReporter can be distributed without any GPFReporter royalties.

Each developer needs his own license to use GPFReporter. (Need to buy more licenses?)

This product is provided as-is. Use it entirely at your own risk. Use of this product implies your acceptance of this, along with the recognition of copyright stated above. In no way will CapeSoft Software, their employees or affiliates be liable in any way for any damages or business losses you may incur as a direct or indirect result of using this product.

horizontal rule

bulletVersion History

 Click Here for the Version History.


[End of document]