NOTE: Insight Graphing 2 requires Draw.
If you do not yet own a copy of Draw, you'll need to purchase a copy when
you buy the upgrade to Insight Graphing 2.
Introduction
If a picture is worth a thousand words, then nothing
shows numerical data better than a graph. Insight Graphing allows you to
add graphs to your Clarion Windows, or Reports. But more importantly than
just the ability, it also provides a powerful template interface which
allows you to graph data directly out of your files, queues or memory.
It also features complete control over the look of your graph, from the
axis settings, to the graph itself, even the legend. You control the
colors, the fonts, the positioning, basically everything. Of course having
control is nice, but only if you don't have to do much, so we've also
included lots of default styles to choose from.
Insight Graphing currently supports Bar, Line, Pie, Donut, Gantt, Pareto
and Time graphs, with many more (like Polar, Radar, Histogram, Hi-Lo,
Open-Close and so on) coming soon.
Feature list
Graphing Engine
- Support for Bar, Pareto, Line, Gantt, Time, Donut and Pie Charts
(lots more to come)
- 2D or 3D look
- Fast drawing engine with automatic shading
- Automatic axis labeling
Template
- Dynamic Interface, exposes more options as you learn
- Directly interfaces to your Dictionary
- Supports on-the-fly calculations while graphing
- Supports counting of records, totals and averages
- Graph from file, view, queue or memory
Graphing on Windows
- Allows multiple graphs on all window types (browses, forms etc.)
- Allows for mouse-over information
- Allows for Right-Click options, like Drill Down, Print and Save
As...
Graphing on Reports
- Allows placement of the graph at the beginning or end of the
report, or at some other point under your control
- Allows graphs to be added to existing reports
- Multiple graphs on 1 report allowed, in any layout configuration
General
- No Hand-Code required
- All settings can be changed at runtime
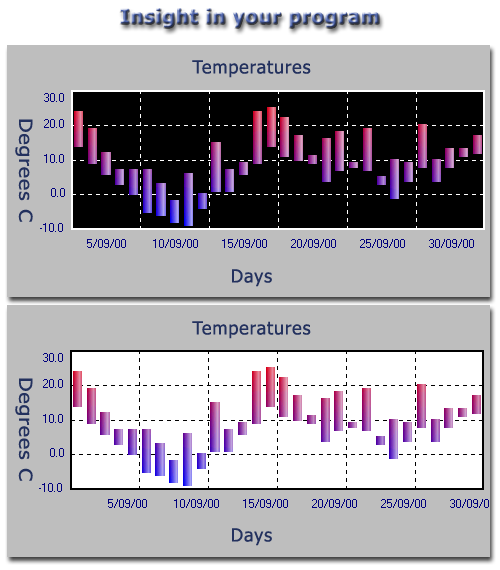
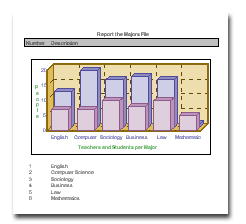
Screen Shots
New Features in Insight
Graphing 2
What the Users Say...
- This product is probably the biggest Clarion surprise so far--how
EASY it is to achieve a result. For a few minutes I was totally lost
because I did not understand from the documentation exactly what goes
where. However, I began with "advanced" and after some minutes was
producing BEAUTIFUL pie charts. Part of a day later they were VERY
EASY and very good looking. This makes Insight Graphing about the
biggest bang (end-user-friendly result) I've had for the smallest buck
(shortest learning curve in history). - Kent Busse
- I am very impressed with Insight – as I am with the other 10 or so
Capesoft products I have, and your support standards are the highest.
- Alison Peters
- What a good addition Insight Graphing is for our business. Great
work.- Ian Patteson
- Insight is such a magnificent tool that I would not want to use any
other option. - Theo von Solms
Compatible With
| Clarion 8 |
Yes |
| Clarion 9 / 9.1 |
Yes |
| Clarion 10 |
Yes |
| Clarion 11 / 11.1 |
Yes |
| Clarion Templates |
Yes |
| ABC Templates |
Yes |
| AnyScreen |
Yes |
| Local Mode |
Yes |
| DLL Mode |
Yes |
| Multi DLL |
Yes |
Documentation & Support
Documentation for the product is available
here.
Old Insight Graphing 1 docs
here)
Go
here for further support.
Cost
| The price of Insight Graphing is $497.
It is available for purchase from ClarionShop. |
| The upgrade is available for purchase at $197
from ClarionShop. |
NOTE: Insight Graphing 2 requires Draw.
If you do not yet own a copy of Draw, you'll need to purchase a
copy when you buy the upgrade to Insight Graphing 2.
|
For other payment options please contact us
here
Refund Policy
CapeSoft believes that if you aren't satisfied with
our products, we would like them back - and we will refund you the money.
This allows you to purchase our products with confidence. You can read our
full refund policy
here.
